

The Correlation Turned. Positioning didn't.
The EUR/USD 60-day correlation went positive for the first time in five weeks—while leveraged money sits at the 15th percentile, CROWDED SHORT.

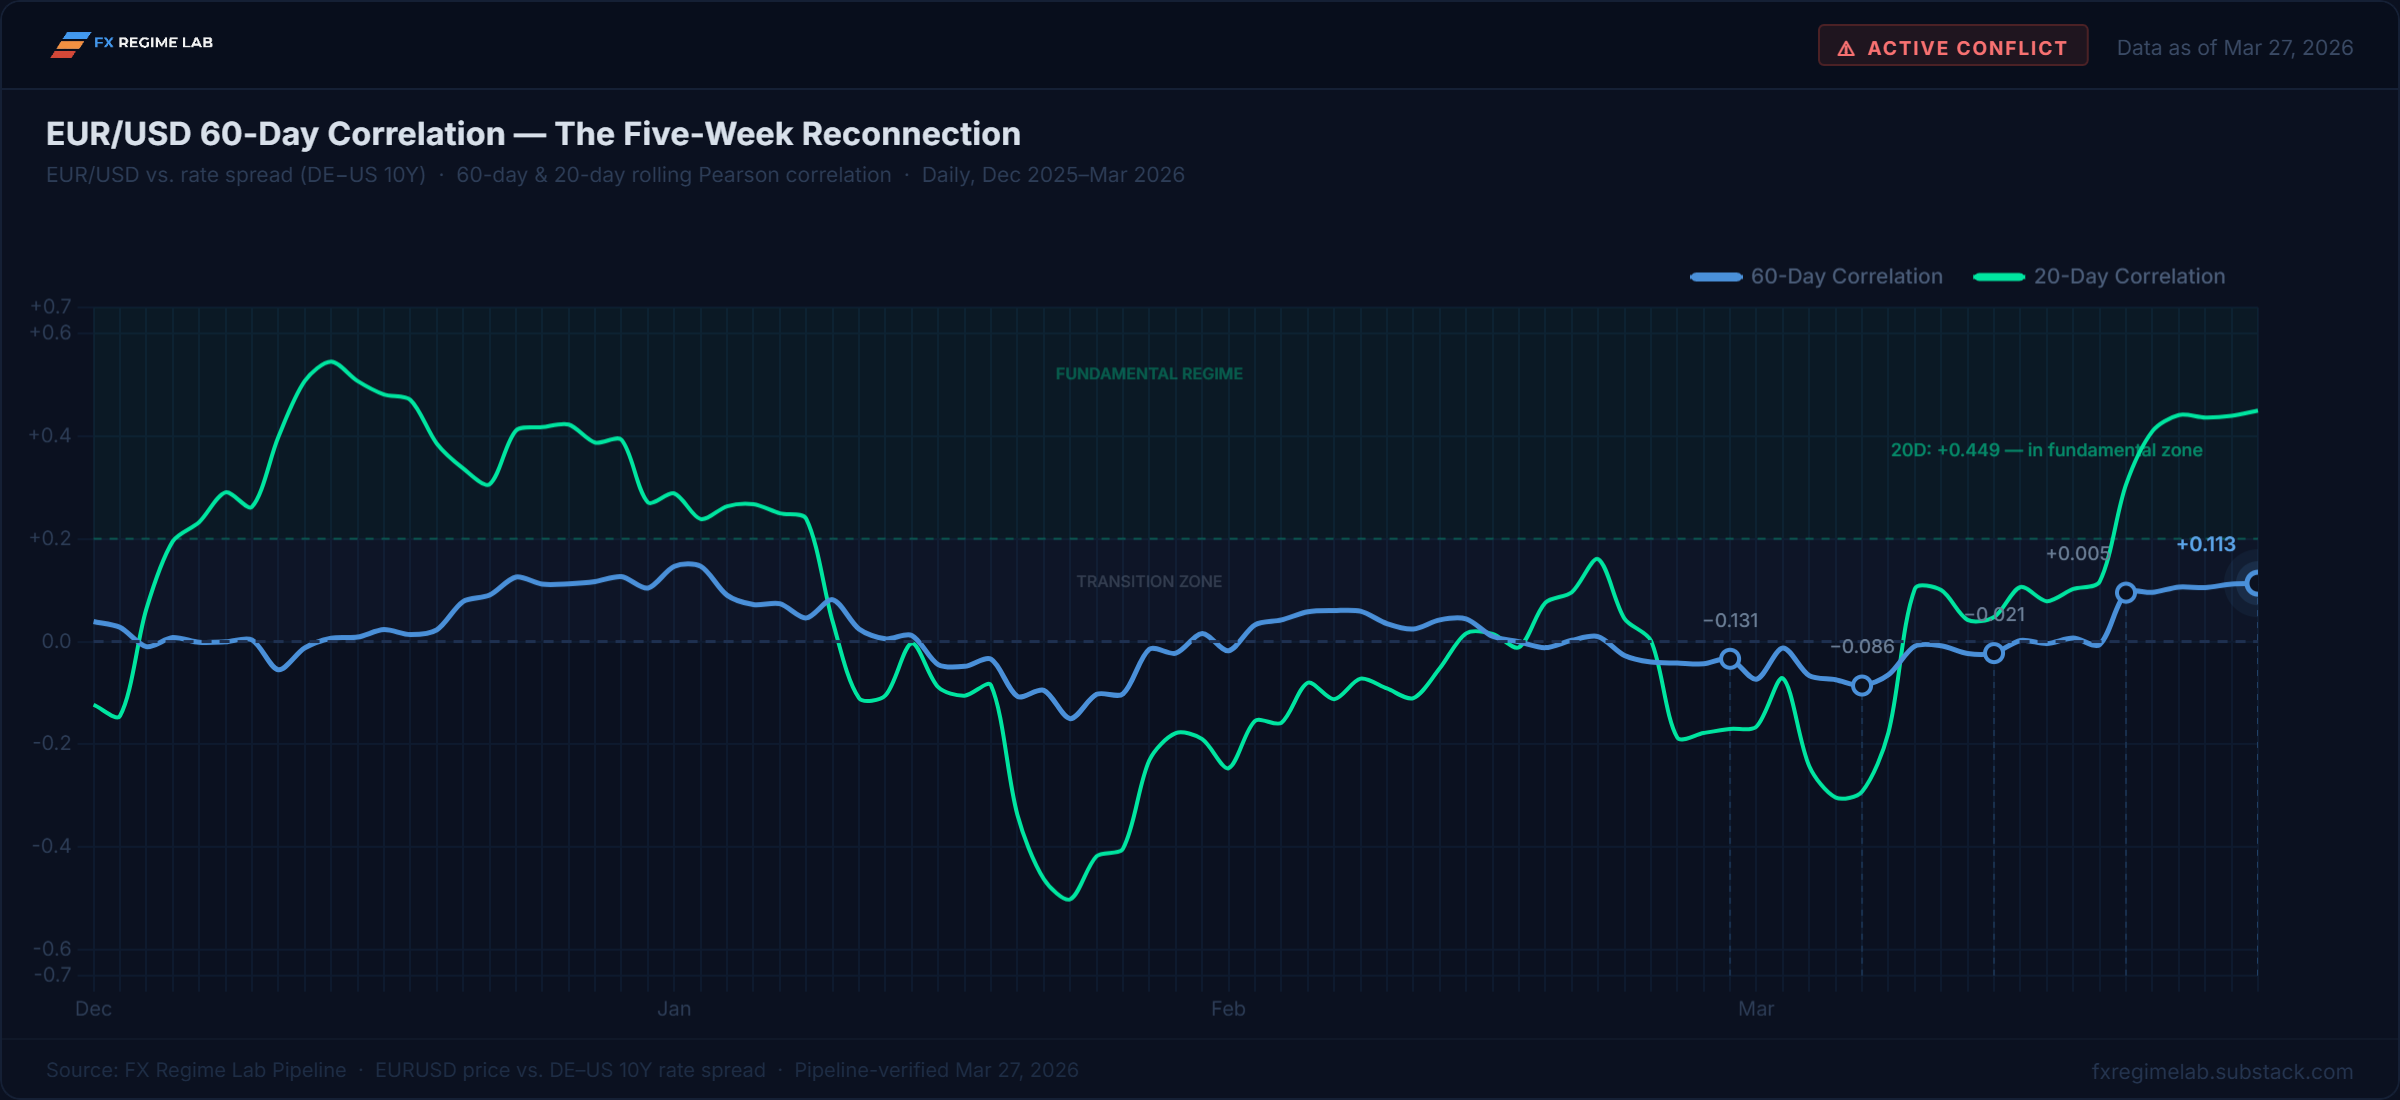
For four weeks this framework has tracked a single number: the 60-day rolling correlation between EUR/USD and the US-DE rate spread. It measures whether the fundamental driver — the rate differential between the US and Europe — is actually moving the currency. When it’s positive and above +0.20, the regime is fundamental. When it’s near zero or negative, something else is driving the price.
On February 27, it was -0.131. Broken. The war had overwhelmed fundamentals. On March 6, -0.086. Still broken. On March 14, -0.021. Approaching zero. On March 20, +0.005. Zero. This week it printed +0.113.
The reconnection is no longer forming. It’s here.
EUR/USD — The Setup That Four Weeks Built
The 60-day correlation at +0.113 is the highest reading since early January. The 20-day correlation at +0.449 is the strongest in six months. The fast signal crossed above the +0.20 fundamental regime threshold three weeks ago and has stayed there. The slow signal is following.
This matters because of what’s sitting on the other side. EUR leveraged money deepened to -13,538 contracts at the 15th percentile—CROWDED SHORT. From the 94th percentile five weeks ago to the 15th now. The speculative community has gone from max long to near-max short in five COT reports. Asset managers continued lower to the 29th percentile.
The DXY correlation at -0.086 is flagged EUR-SPECIFIC—meaning EUR is moving on its own drivers, not tracking the dollar. The US-DE 10Y spread at 1.33% has been flat for two weeks, but the 2Y spread compressed 9 basis points this week. The fundamental direction—spread compression means EUR strength—is intact, and now the correlation confirms the market is starting to price it again.
The positioning-versus-regime divergence is the cleanest signal in the framework. Leveraged money is crowded short into a reconnecting fundamental regime that points the other way. The last time this framework detected an equivalent divergence was five weeks ago—crowded long into a breaking regime. EUR/USD fell 5% in three weeks. The mechanics work in both directions.
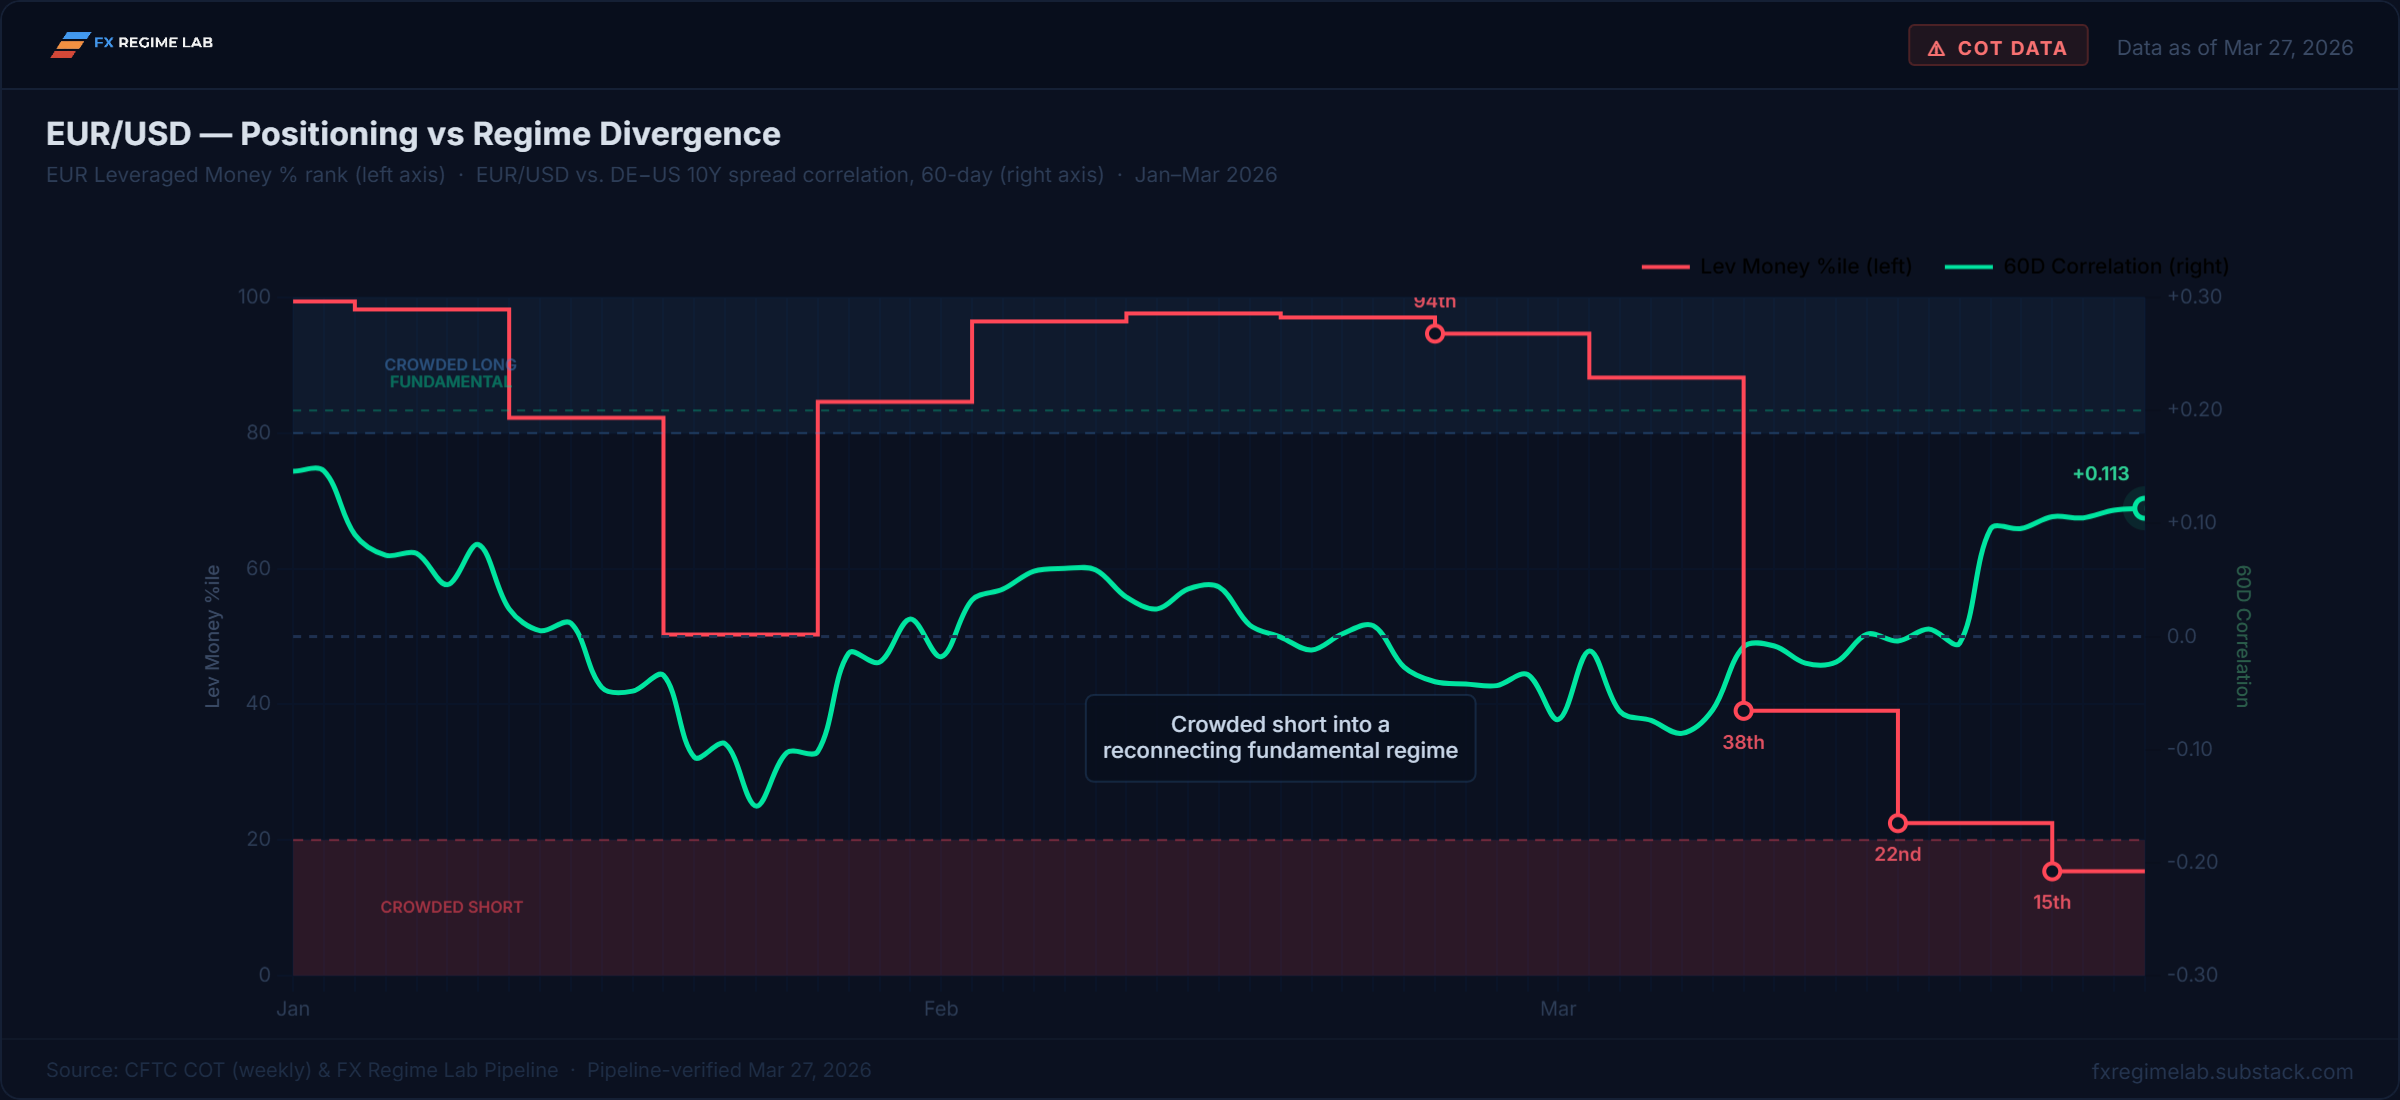
EUR/USD closed at 1.1535, -0.37% on the week. Quiet price action. The kind of quiet that precedes the resolution.
USD/JPY—The Carry Covered, but the Fundamental Signal Turned On
JPY leveraged money bounced from -65,429 (18th percentile, CROWDED SHORT) to -54,852 (29th percentile, NEUTRAL SHORT). The crowded flag cleared. Ten thousand contracts of carry were unwound.
But the more important move happened in the correlation. The 60-day spread correlation flipped to -0.122. The 20-day collapsed to -0.472, the strongest negative reading in months. In the framework’s language, negative correlation on USD/JPY means the rate differential is actively pulling the price lower. Spread compression should mean USD/JPY falls. For weeks that signal was broken. Now it’s working—on the short timeframe aggressively and on the 60-day for the first time since the war started.
USD/JPY closed at 159.70, +1.13% on the week. Price went up while the correlation turned negative. That’s the same divergence pattern EUR showed in reverse—the regime signal moving one way, positioning and price still leaning the other.
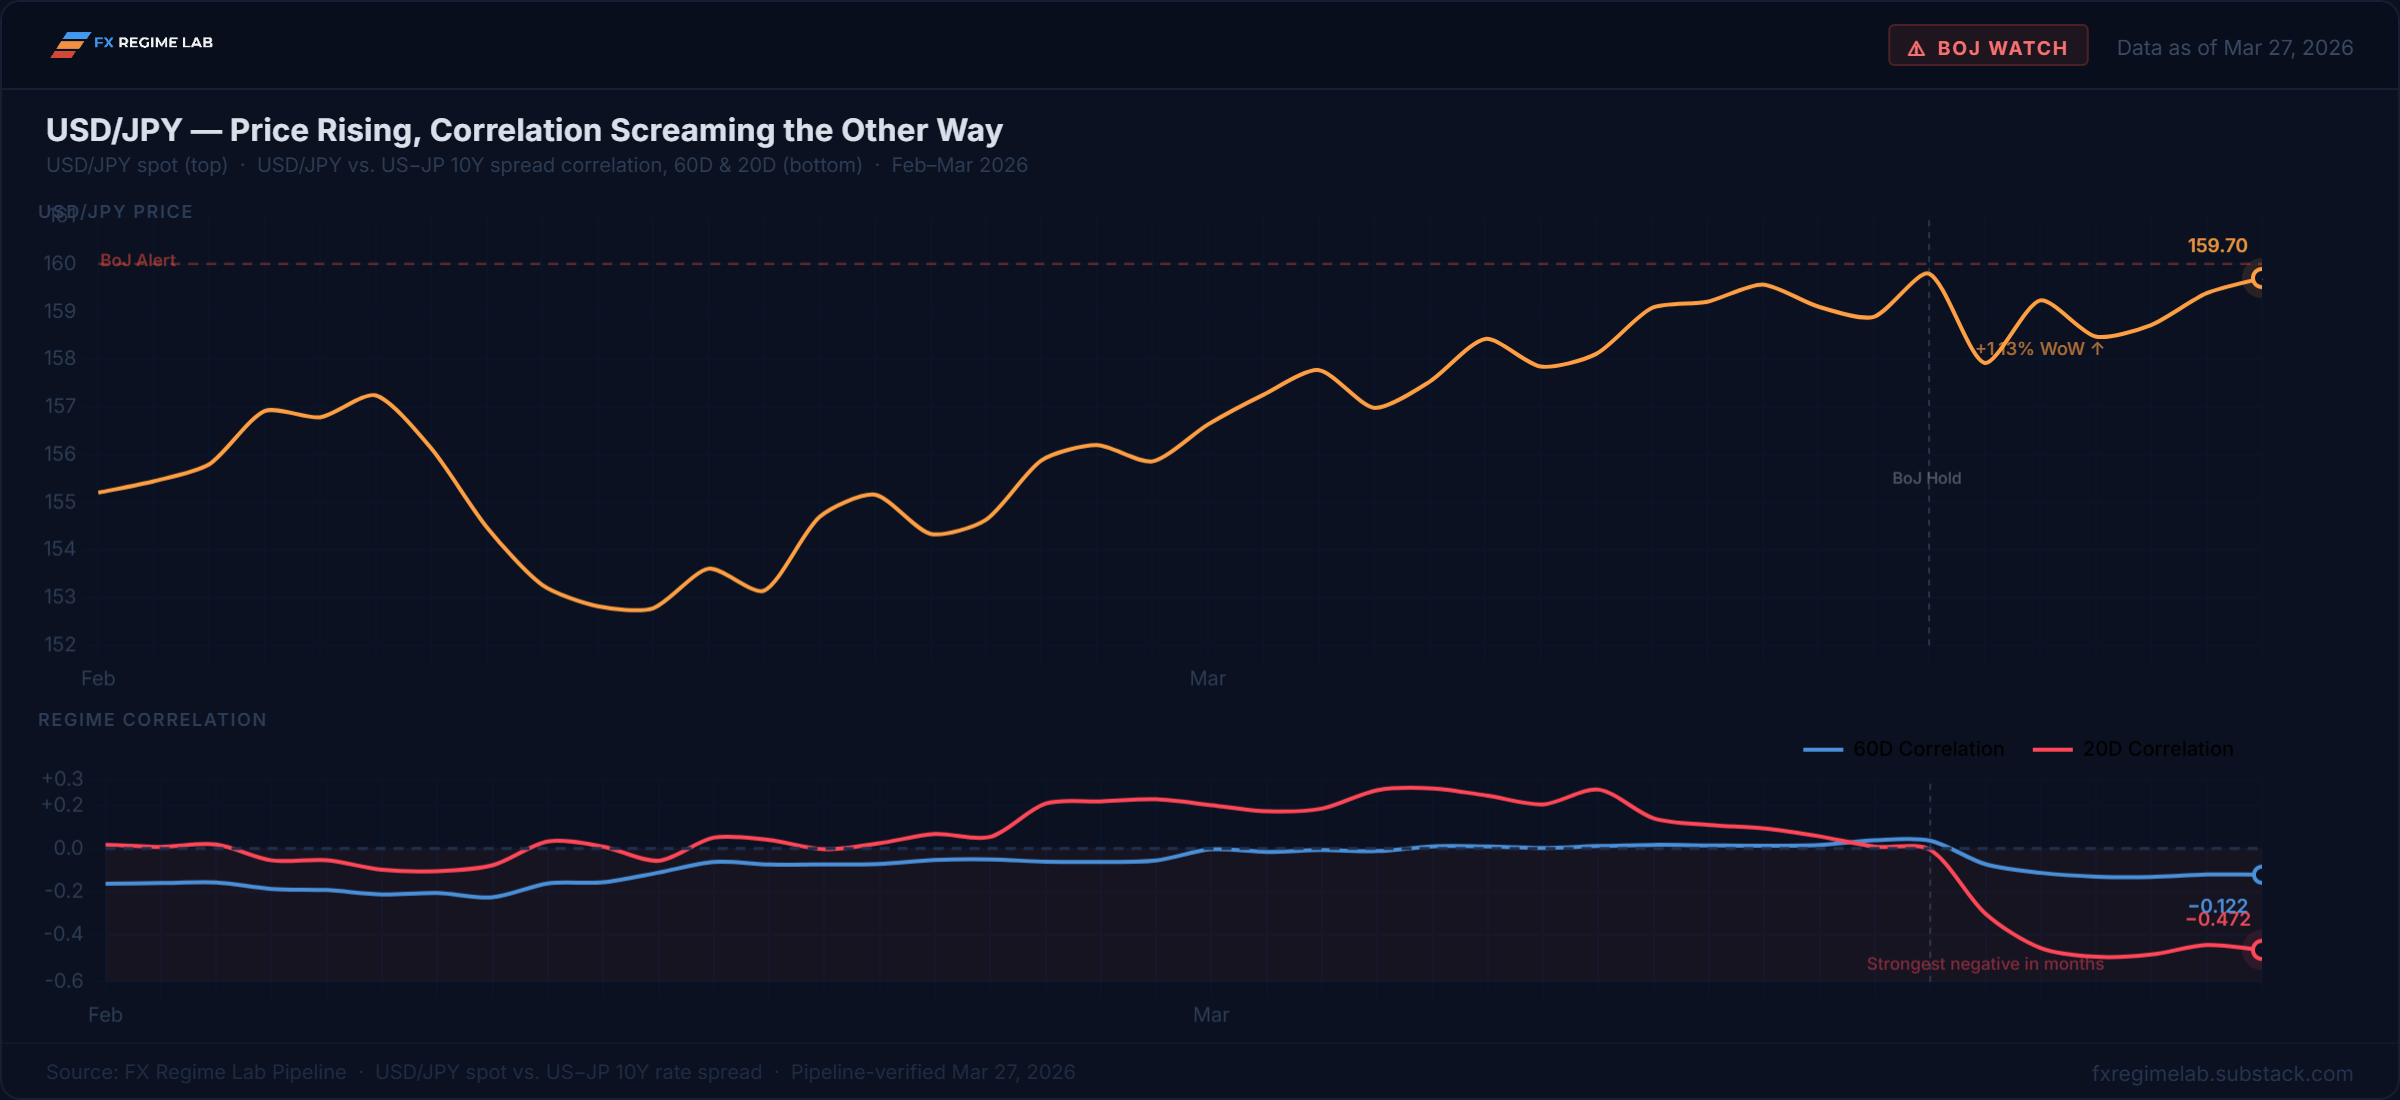
Ueda kept April on the table. Shunto wage talks delivered strong results. The US-JP 10Y spread at 2.13% widened slightly, but the 20D correlation says the market is starting to trade on the direction, not the level. If the 60-day follows the 20-day into sustained negative territory, the framework will flag a regime transition toward fundamental—and at 29th percentile positioning, there’s room for the carry to unwind further.
USD/INR—The RBI Changed the Rules
On Friday the RBI imposed a $100 million cap on net open USD/INR positions for banks. First time. The rupee had hit 94.84 intraday—an all-time low. Down 10% on the fiscal year, the worst since the taper tantrum.
This isn’t intervention. This is structural. The RBI is no longer just selling dollars to defend a level. It’s restricting the market’s ability to build speculative positions against the rupee. The message: managed depreciation, not a floor defense.
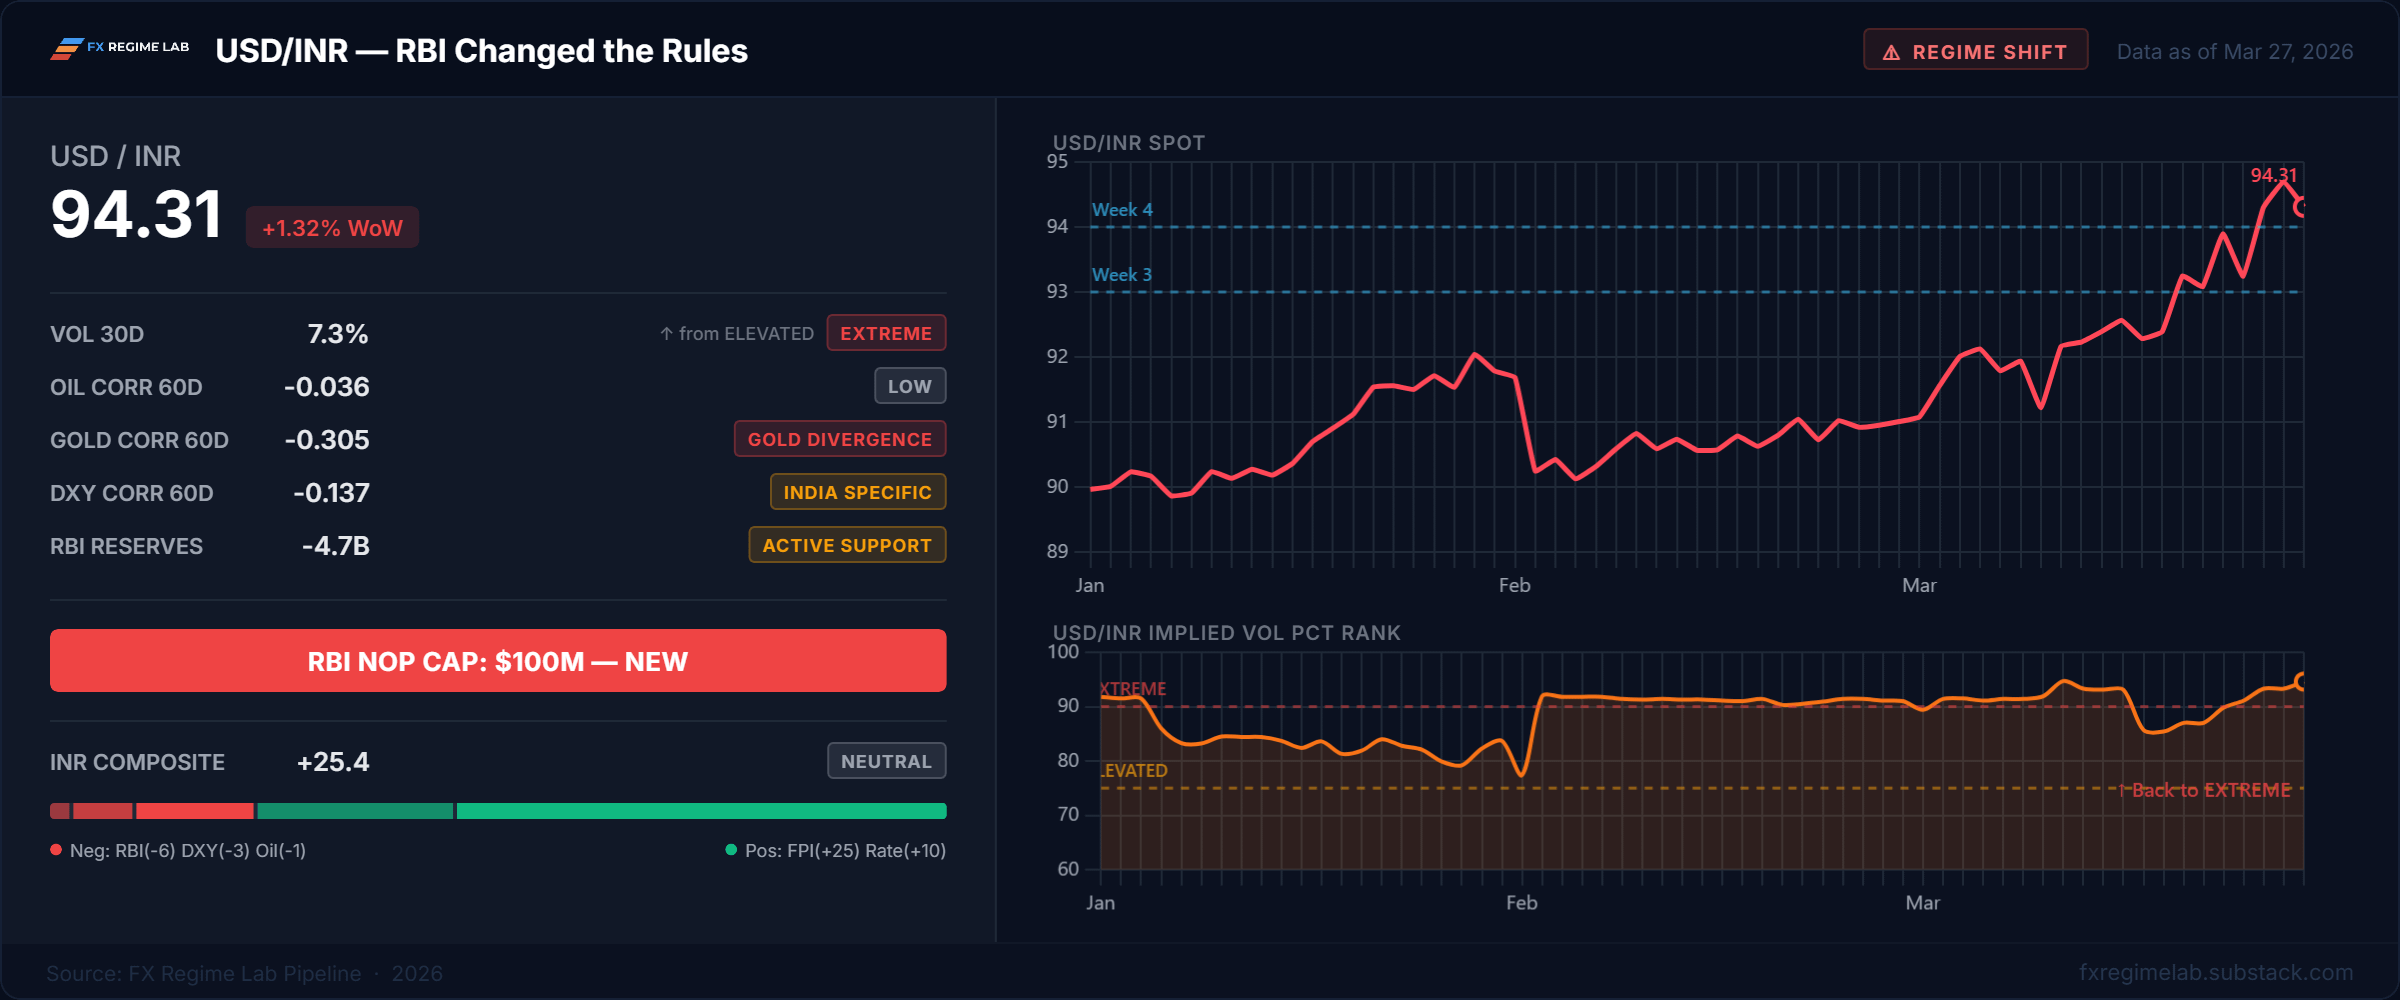
The framework reads it clearly. Volatility is back to EXTREME at the 95th percentile. FPI trailing 20-day outflows deepened to -78,528 crore. The INR composite at +25.4 is NEUTRAL—but the components tell the real story. FPI scores +25 because the pace of outflow is decelerating even as cumulative numbers grow. Oil is now −1 (neutral—the framework’s oil correlation dropped to −0.036, essentially zero). RBI scores -6. Rate differential still contributes +10.
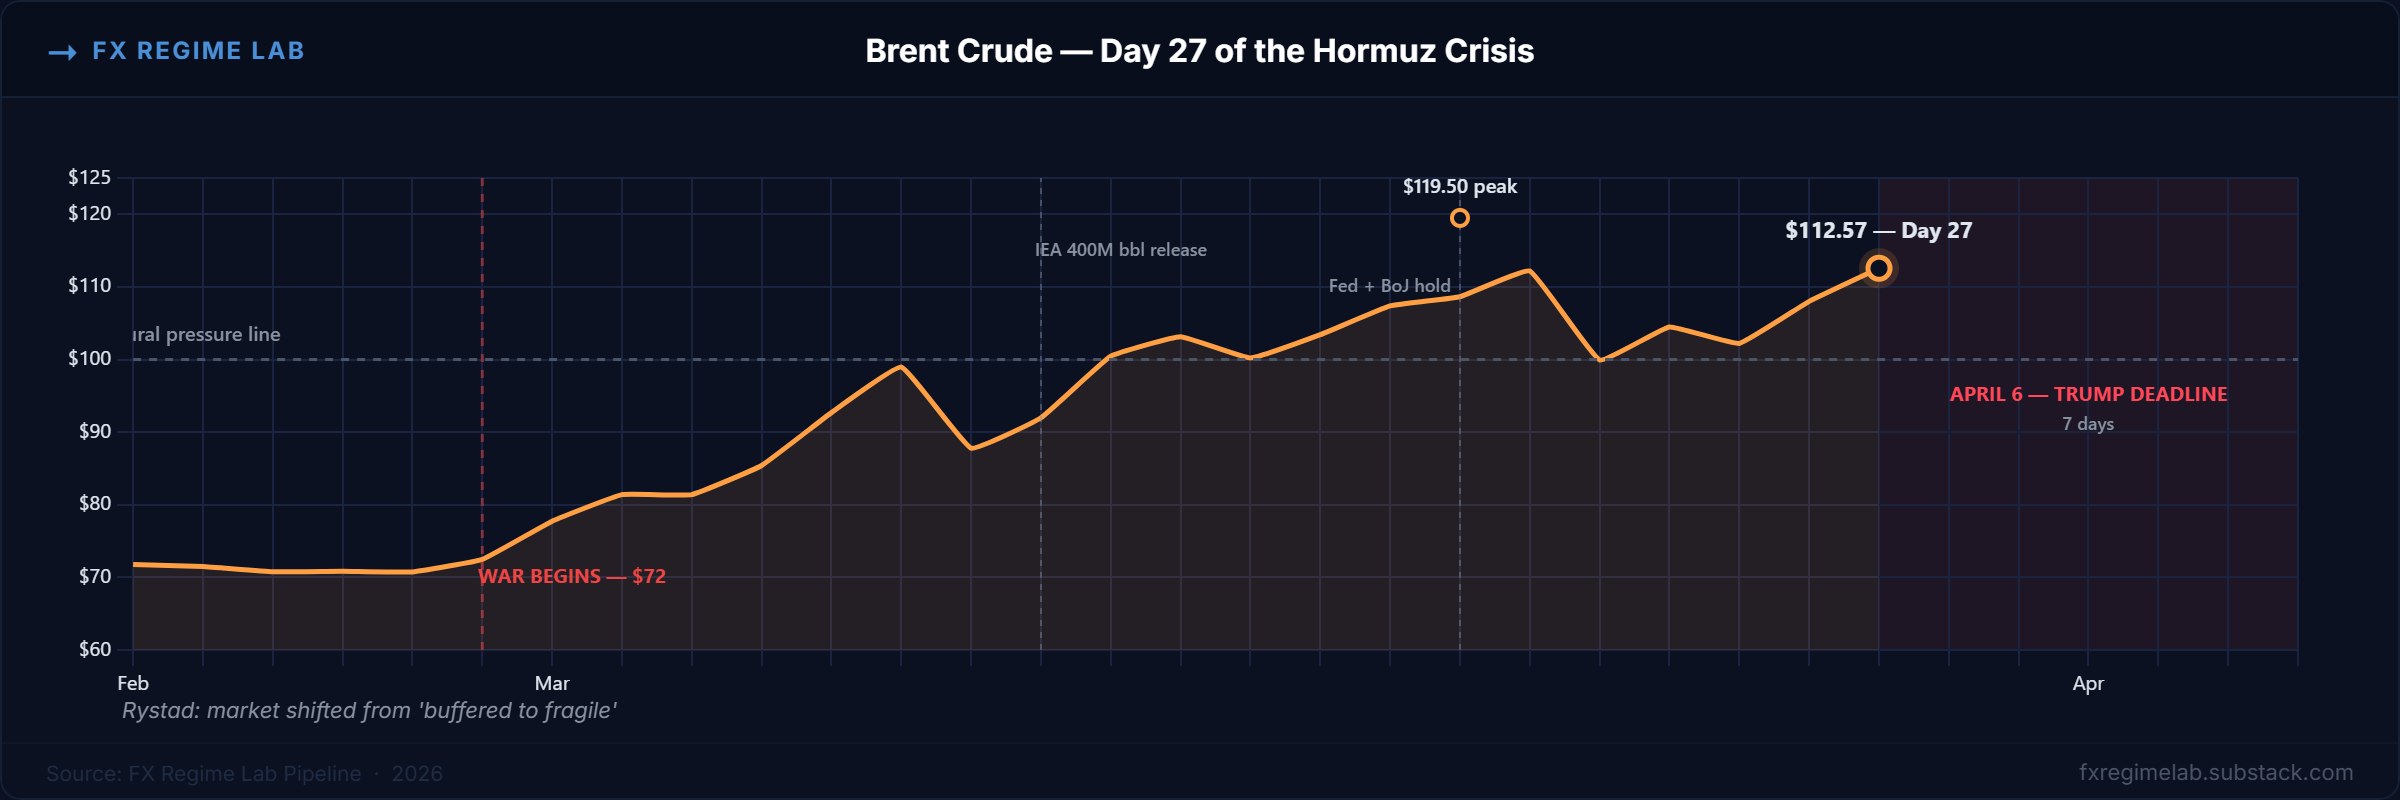
The gold-INR correlation at -0.305 is the deepest GOLD DIVERGENCE reading in the framework’s history. Gold falling while INR weakens means India is likely selling gold reserves or gold-denominated assets to fund intervention. Bernstein’s target: 98 per dollar if Hormuz stays closed. The Hormuz crisis entered day 27 on Friday. Rystad’s assessment: the global oil buffer has shifted from “buffered to fragile.”
What The Framework Is Watching
EUR/USD 60-day correlation at +0.113: The critical threshold is +0.20. The 20-day is already at +0.449. If the 60-day crosses +0.20 next week, the fundamental regime officially reasserts itself—and leveraged money at the 15th percentile is on the wrong side.
USD/JPY 20-day correlation at -0.472: The fast signal is screaming that fundamentals are pulling USD/JPY lower. Price hasn’t followed. If the 60-day (currently -0.122) deepens below -0.20, the framework flags a regime transition. Watch the BoJ April meeting date for the catalyst.
April 6 — Tru’s Hormuz deadline: The president extended the pause on strikes against Iranian energy infrastructure to April 6. If the deadline passes without resolution, BCA Research estimates the oil supply loss doubles to 9-10 million bpd by mid-April. That’s the cliff.
Three signals. Three thresholds. The framework will update daily at the link below.
All data sourced from CFTC Disaggregated Financial Futures (24 March cutoff, published 27 March), FRED, ECB SDW, Japan MOF, RBI FBIL, Yahoo Finance, IEA. Pipeline runs daily. This is not investment advice.
The live morning brief: G10 FX Regime Detection Framework